

DiskView Visualizer Basics
The DiskView Visualizer uses a combination of color, shape, size, texture and transparency to represent various attributes of the file-system. For example, hidden files and folders are transparent, newer are bright, system files have distinctive patterns and file-system attributes are depicted with icons.
With one glance, you can see which files and folders are taking up the most disk-space, and understand your file and folder structure. With the visual maps that DiskView generates, it becomes easy to organize a huge number of files and folders, and manage disk space efficiently.
Showing, Hiding and Resizing
The DiskView Visualizer appears in the right hand pane of Windows Explorer, and can be easily shown, hidden or resized. It can be turned on and off using the ![]() toggle button in the DiskView Toolbar, or by using the View > Explorer Bars > DiskView Visualizer menu option in Windows Explorer.
toggle button in the DiskView Toolbar, or by using the View > Explorer Bars > DiskView Visualizer menu option in Windows Explorer.
The Visualizer can be resized by dragging its top-edge using the mouse.
Visualization Modes
The visualization modes can be selected from among Pie chart mode and Bar chart mode using the ![]() Pie and
Pie and ![]() Bar chart toggle buttons, or the
Bar chart toggle buttons, or the ![]() Drop-down list for selecting chart type from the Visualizer's toolbar.
Drop-down list for selecting chart type from the Visualizer's toolbar.
Pie-chart Visualization Mode
Bar-chart Visualization mode
The Visualizer can be resized by dragging its top-edge using the mouse.
DiskView Visualizer Tools and Functions
The DiskView Visualizer offers a wide range of functions accessible from its toolbar. The tools and functions available are described in detail on the DiskView Visualizer Toolbar page.
Visual cues shown by DiskView Visualizer
Files are represented with a patterened fill. Folders are represented with smooth fill. Hidden files and folders are lighter in color, and have a transparent appearance. System files have a textured appearance showing the Windows™![]() logo.
logo.
In addition, DiskView Visualizer represents the relative age of files and folders by their brightness. Thus, big old files and folders can be easily identified by their large size and pale colors.
Other attributes of files and folders are shown using the following icons:
| Compressed | |
| Encrypted | |
| Read-only | |
| Reparse point | |
| Temporary | |
| System file or folder |
On hovering the mouse over the pies/bars, tool-tips showing the file or folder name, size and modification date are displayed.
Summary View
The Summary View shows the current disk space usage for all local drives, and a graphical view of the disk space usage of the current folder with respect to the total occupied space on the disk and the disk capacity.
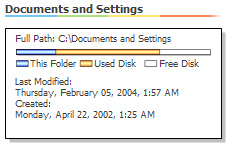 |
In the summary view, the white, blue and orange bars show disk usage of the current folder with respect to the total disk capacity as well as the total used disk space in the current drive. The length of the bottom bar represents the full capacity of the current drive, of which the white portion is the free space on the drive. The orange bar represents how much of the drive space is occupied. The blue bar lying on top of the orange bar shows how much of the disk space is taken up by the current folder and all its sub-folders and the files contained in it. |
The summary view can be shown or hidden using the ![]() Summary View toggle button on DiskView Visualizer's toolbar.
Summary View toggle button on DiskView Visualizer's toolbar.
Customization Options
A number of aspects of the DiskView Visualizer are customizable using the ![]() DiskView Options button.
The options can be configured from the Visualizer tab of the DiskView Options dialog.
DiskView Options button.
The options can be configured from the Visualizer tab of the DiskView Options dialog.
File-system Navigation and Operations
Each pie or bar representing a Folder is a clickable 'hyperlink' that navigates Windows Explorer to that folder.
To navigate to the parent folder, click on the grey circle at the top (showing Total size) in the Pie-chart visualization mode. In the Bar chart visualization mode, click on the ![]() icon to navigate to the parent folder.
icon to navigate to the parent folder.
Each pie or bar representing a File (with a textured pattern) responds to double-click and right click just like files shown in other views of Windows Explorer. Double clicking opens the selected file using the associated application - for example, double clicking on a Word Document (*.doc) file would open Microsoft Word with that document.
You can 'right click' on the pies or bars to get the familiar shell context menu and select tasks to be performed on that file or folder.